Data Model in the Report Module
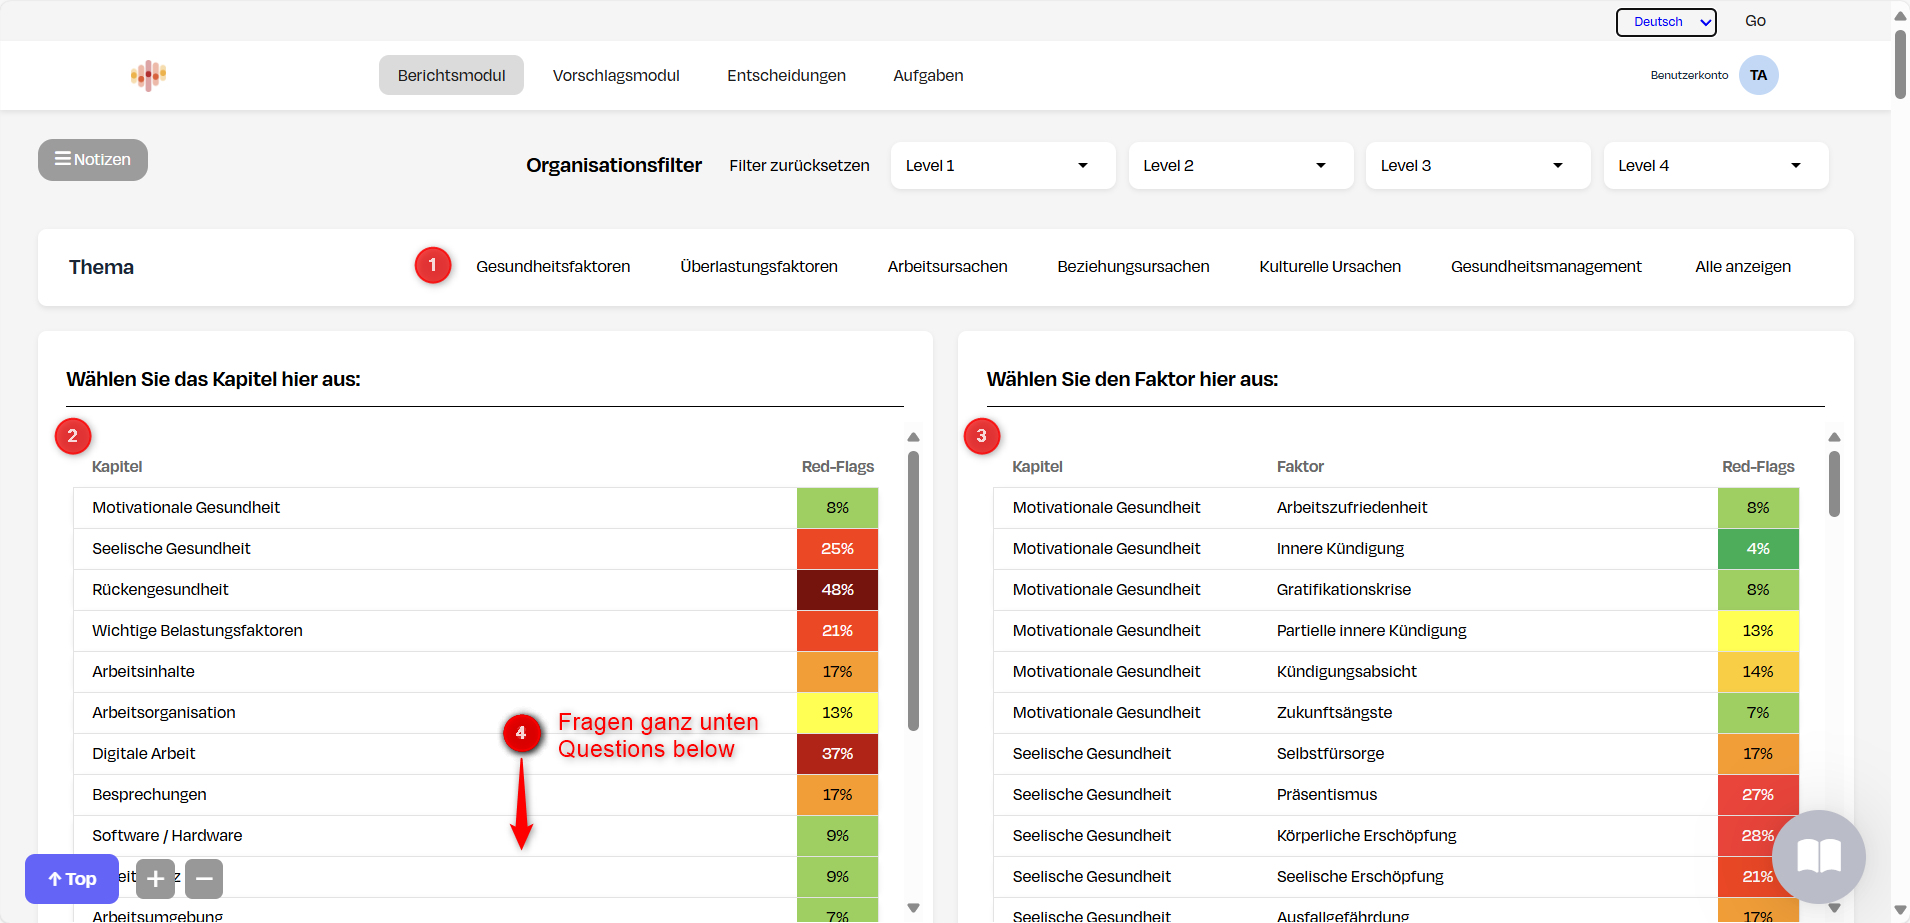 Figure: Structure of the data hierarchy with marked levels ①–④
The report module in the Eudemos Insight Portal is designed so that you can systematically work from the overview down to the detail of responses. The underlying structure helps you identify relevant focus areas and patterns – while always maintaining contextual depth.
① Topic Areas
At the top level are the topic areas, e.g.:
- Health factors
- Overload factors
- Work causes
- Relationship causes
- Culture causes
These fields structure the overall questionnaire into strategic focus areas. They are the starting points for every analysis.
② Chapters
A chapter bundles several related factors within a topic area – such as "Motivational Health" or "Work Content". Chapters facilitate clustering and thus enable grouping by resource aspects, stress categories, or organizational units.
③ Factors
A factor is the central evaluation unit of the report module. Each factor consists of one or more questions, where typically only a single question provides the numerical factor value. We call this central question the indicator question.
Example:
- Indicator question: "I am generally satisfied with my work."
- Factor value: This value reflects job satisfaction and is used in all reports, comparisons, and evaluations.
Other questions of the same factor – such as
- "I am satisfied with my team" or
- "I am satisfied with the ergonomic conditions" – serve for differentiated consideration, but do not influence the numerical factor value.
These so-called differentiation questions allow for deeper analysis to better understand causes or aspects within a factor. In rare, justified cases, multiple questions contribute to the factor. This information is usually not necessary for managers, which is why we don't mark this in the portal.
The discussion about the meaningfulness of the factor model is conducted through the steering committee.
④ Questions
At the lowest level are the concrete questions. They form the directly visible feedback point and provide detailed insights into nuances. In the report module, you can evaluate each question individually – even if it doesn't contribute to the factor value. You'll find the questions at the very bottom of the frequency display.
Most questions in the portal are ordinal scales with 5 response levels:
1 = very critical to 5 = very uncritical. These directly contribute to the Red-Flag rating.
Some questions are Yes/No questions. Here only the Yes answer counts (marked in blue), while "No" is displayed in gray and missing responses are ignored.
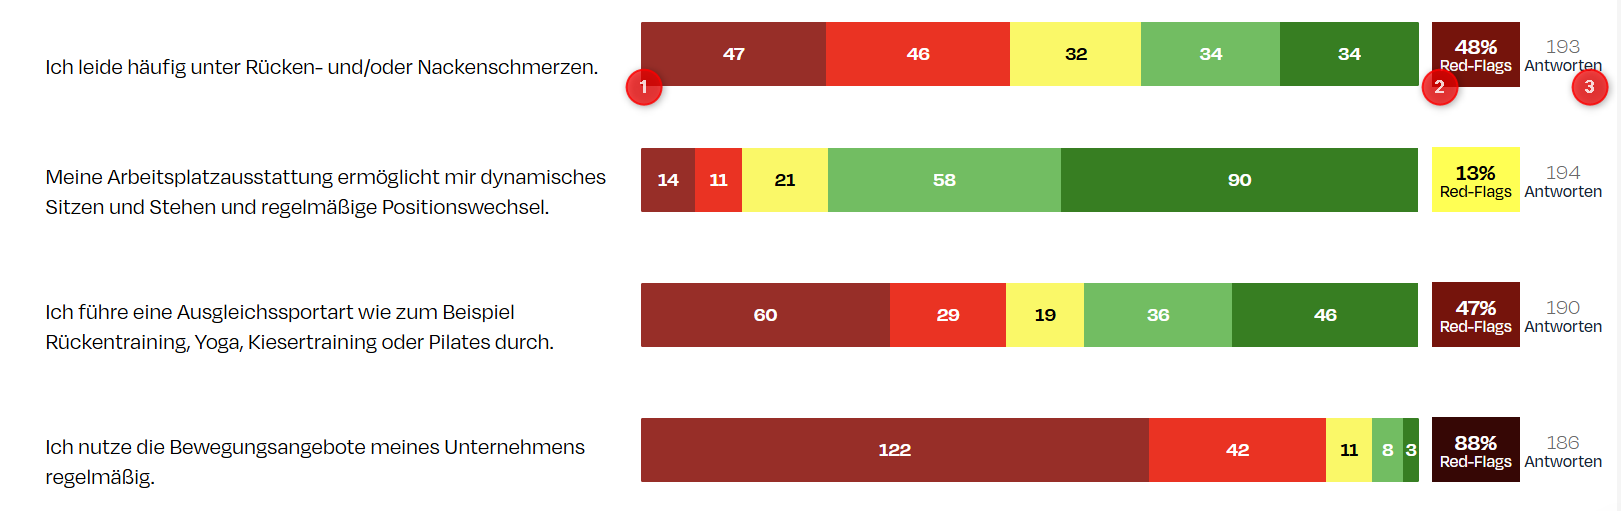 Example individual evaluations with response distribution, Red-Flag value, and participant count.
Legend: 1️⃣ Percentage value of the most critical response level ("1 = very critical") 2️⃣ Total proportion of all critical responses (Level 1 + 2) = Red-Flag value 3️⃣ Number of given responses (without empty entries)
The higher the Red-Flag value, the greater the urgency:
- Green (0–15%): Relaxed
- Yellow (15–30%): Observation value
- Red (30–50%): Notable
- Dark red (>50%): Action required
Conclusion
The data model in the portal is deliberately structured hierarchically to enable both overview and depth. You can drill down from the large topic areas to individual statements – and always see exactly where anomalies arise.
If you want to dive deeper into analysis, the dynamic report module is recommended, with which you can use interactive filters, historical comparisons, and cross-sectional analyses.